OnWheels Project
Removing obstacles with open data
The project
We made a mapping tool, based on OpenStreetMap and MapComplete. Using our tool, anyone can very easily add, view, and edit data about wheelchair accessibility. The map shows POIs and all the details you need to get where you want to go.
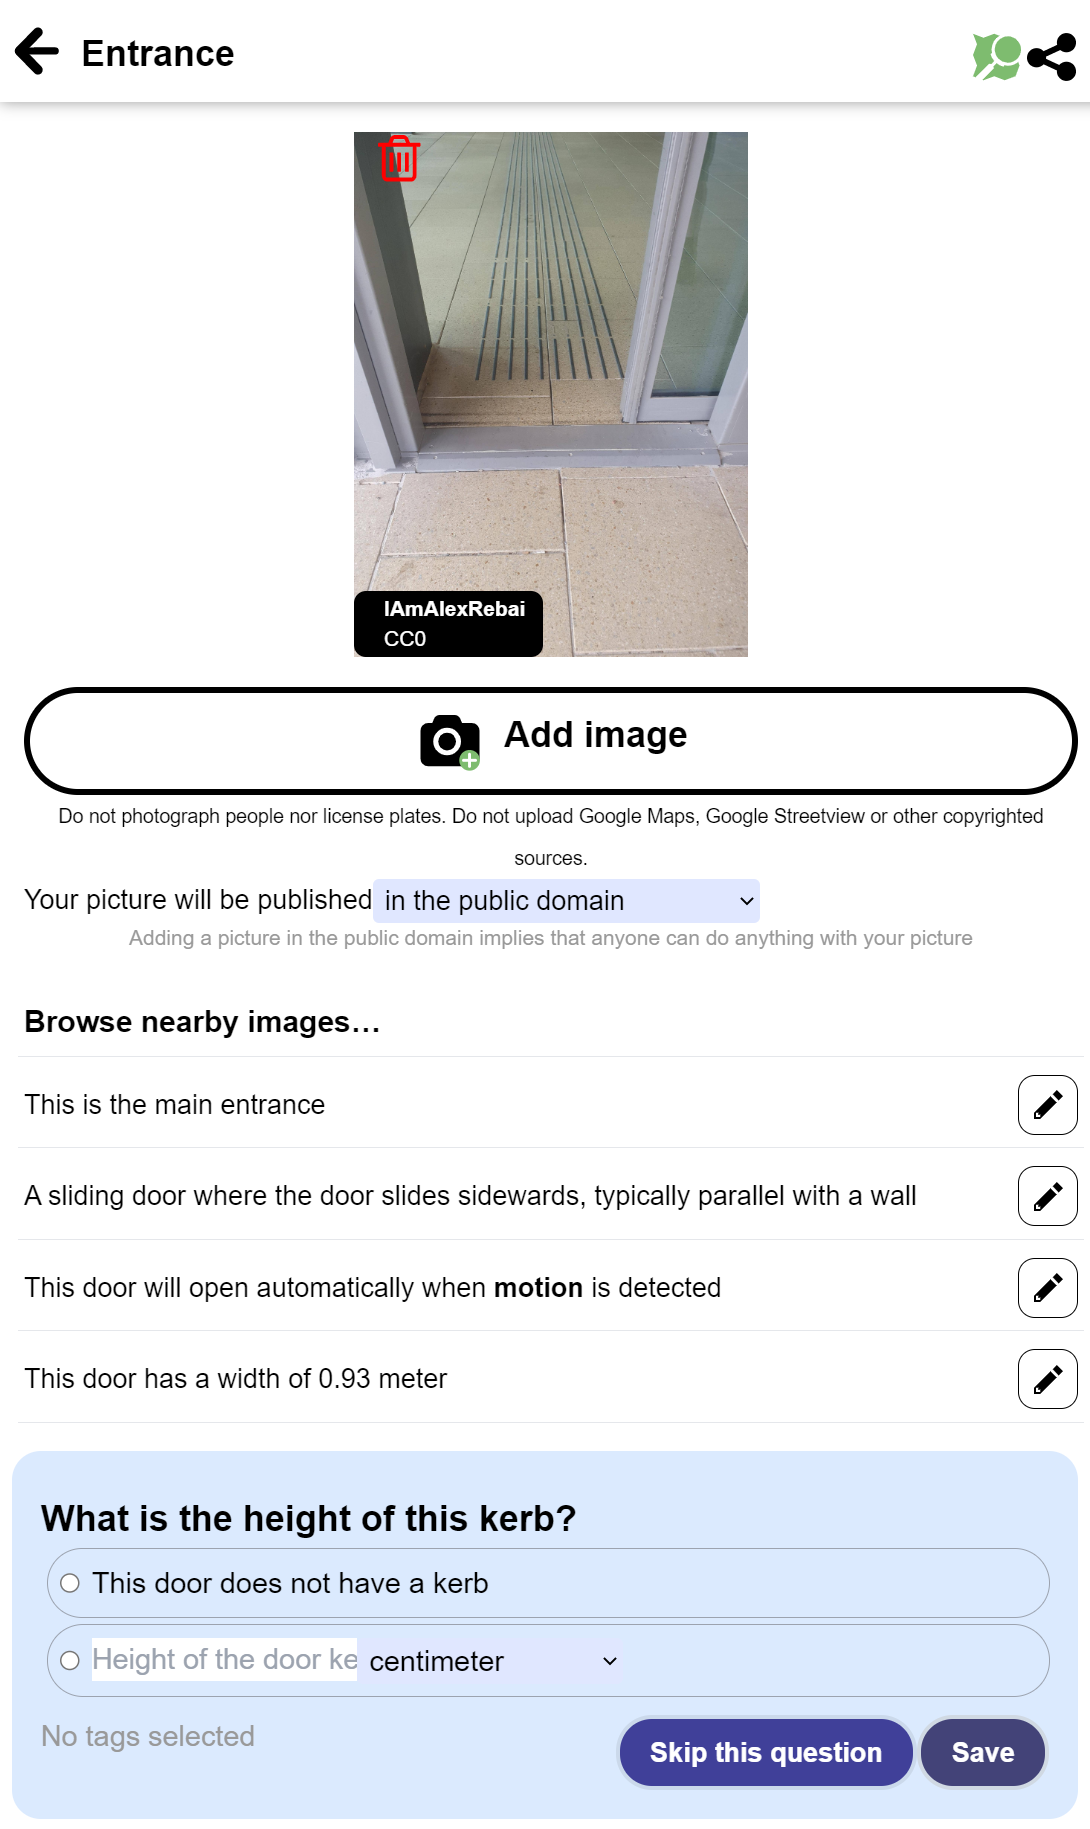
Apart from viewing details, a user can also answer questions about the accessibility and the other details of a POI.
Every attribute is listed as a full sentence, with an icon next to it to change it. If an attribute is not known yet, a question will appear prompting the user for the answer. To help simplify answering the questions, most attributes have a list of presets.
Because of the simplicity of the questions, basically anyone with a computer or smartphone, can now add information and help remove obstacles using open data.
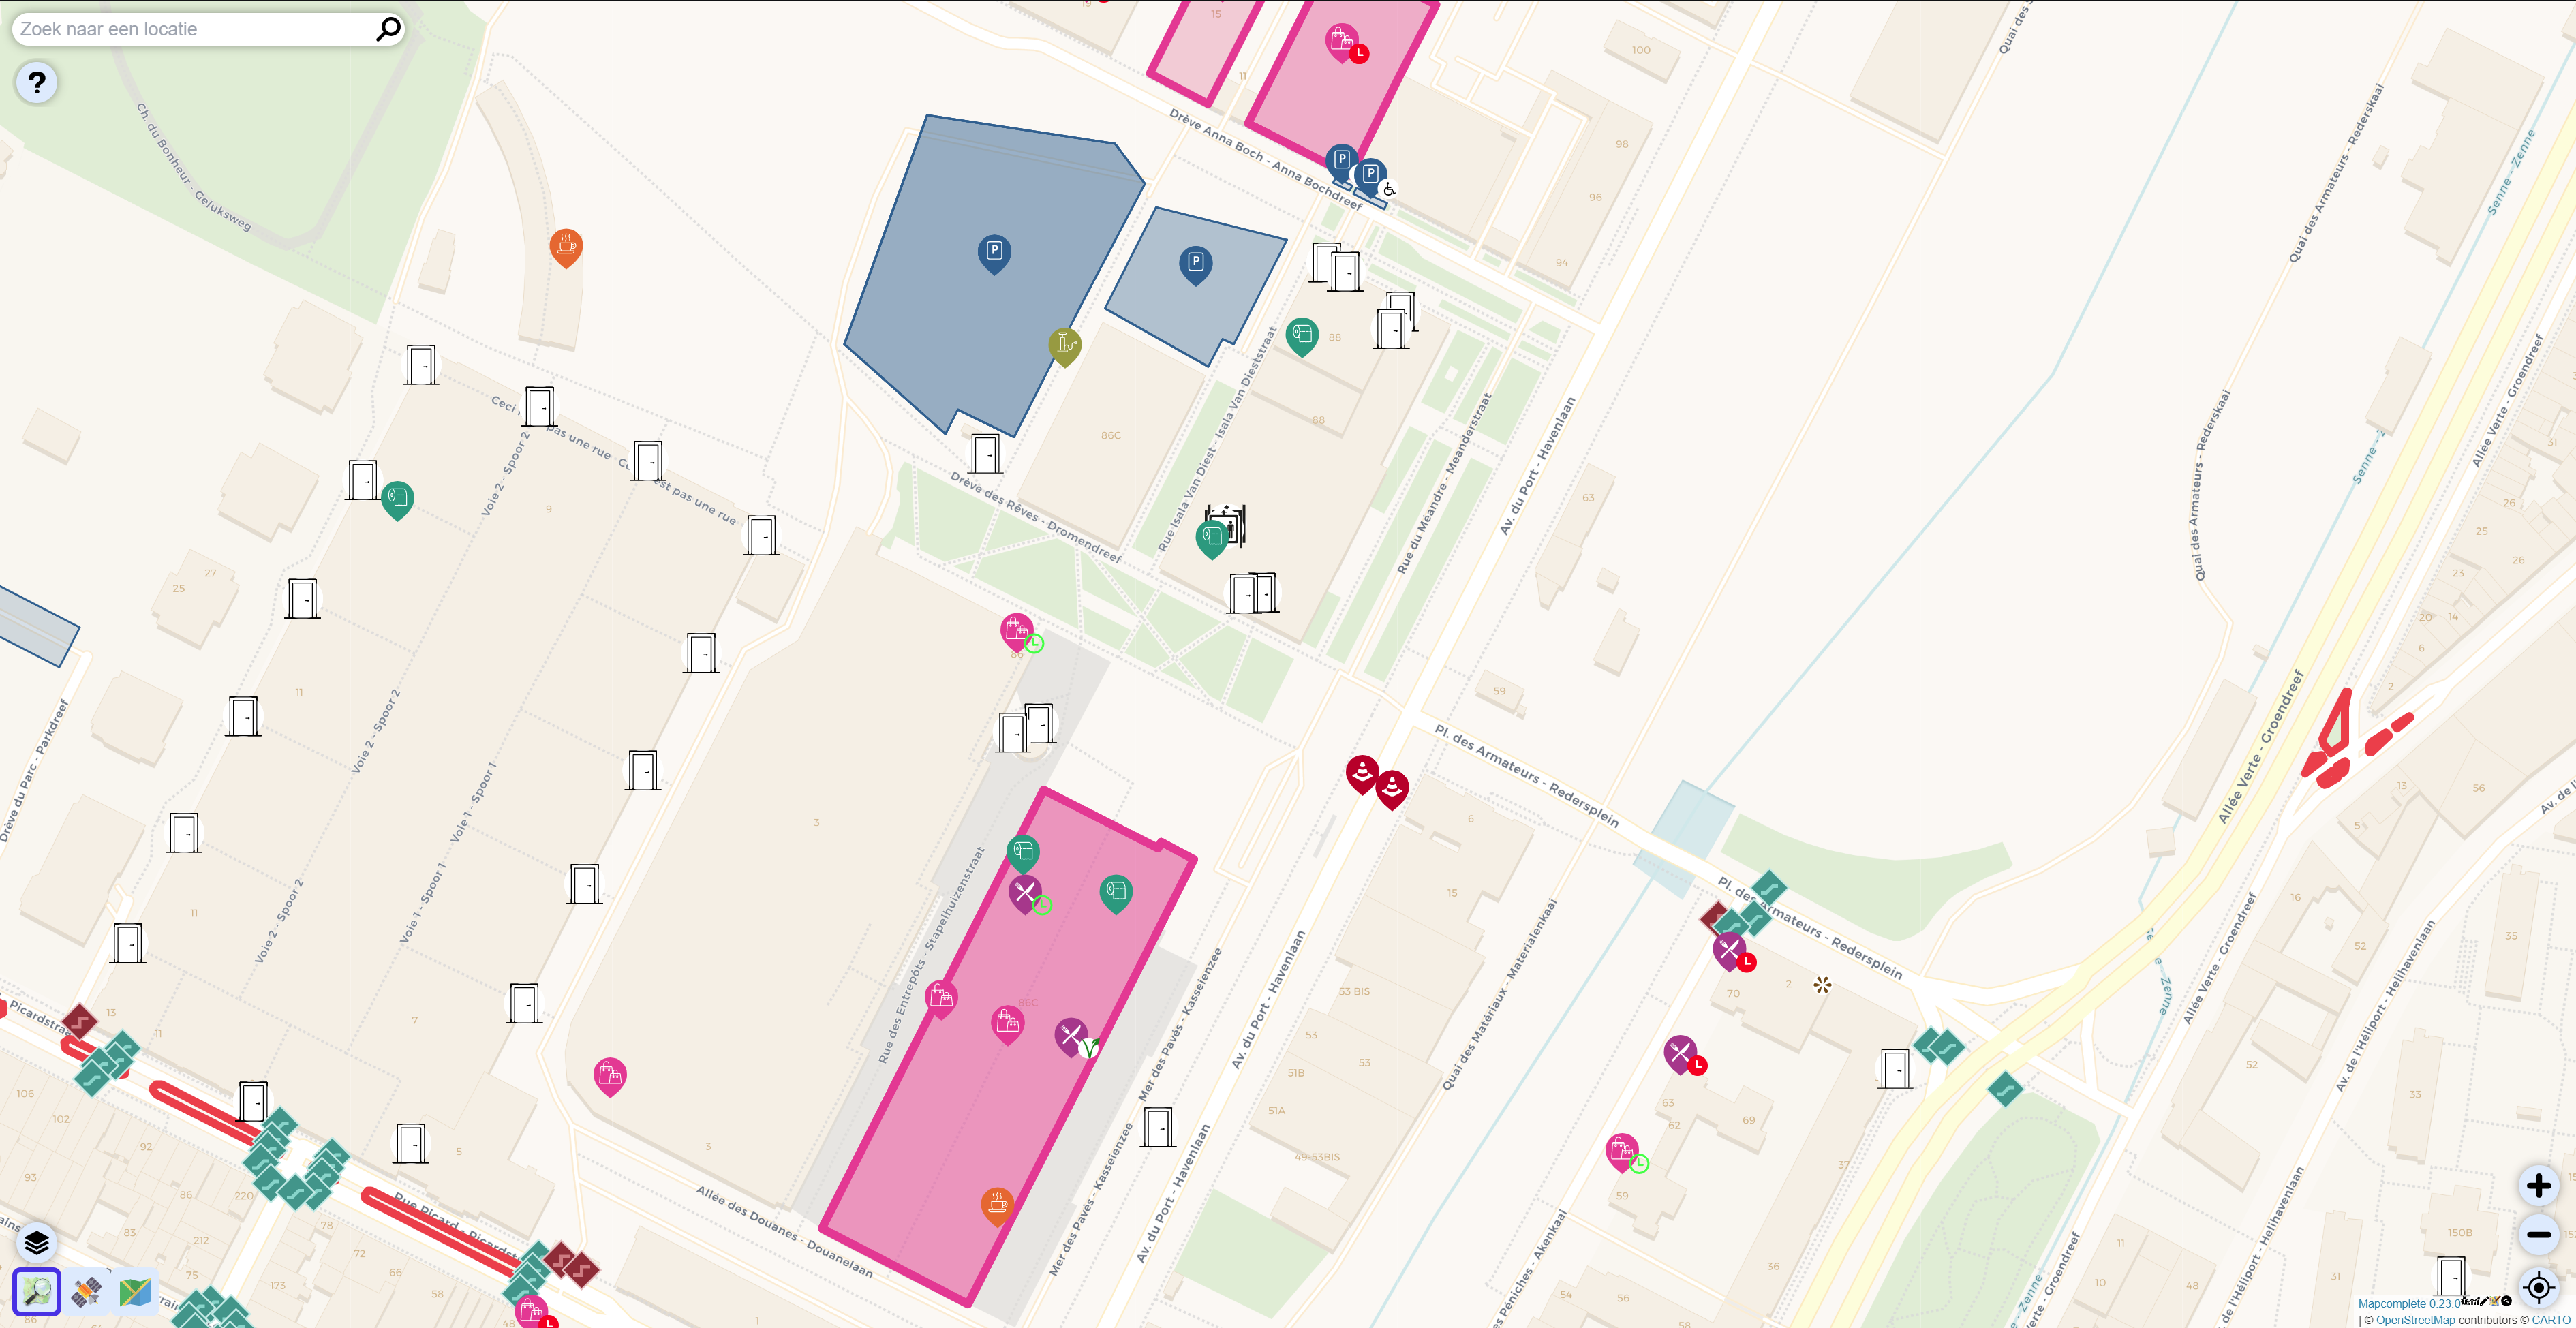
The data for the different categories is styled using different icons and colors to make it easy to find what you want. Some categories like kerbs and parkings are also styled differently based on their attributes to make it even easier to distinguish features at a glance.
To make this possible several new categories were added, like healthcare (doctors, pharmacies and hospitals), transit, government offices, kerbs, hotels, reception desks and even indoor mapping. Also, several layers were improved, like the entrances, toilets and parking layers.
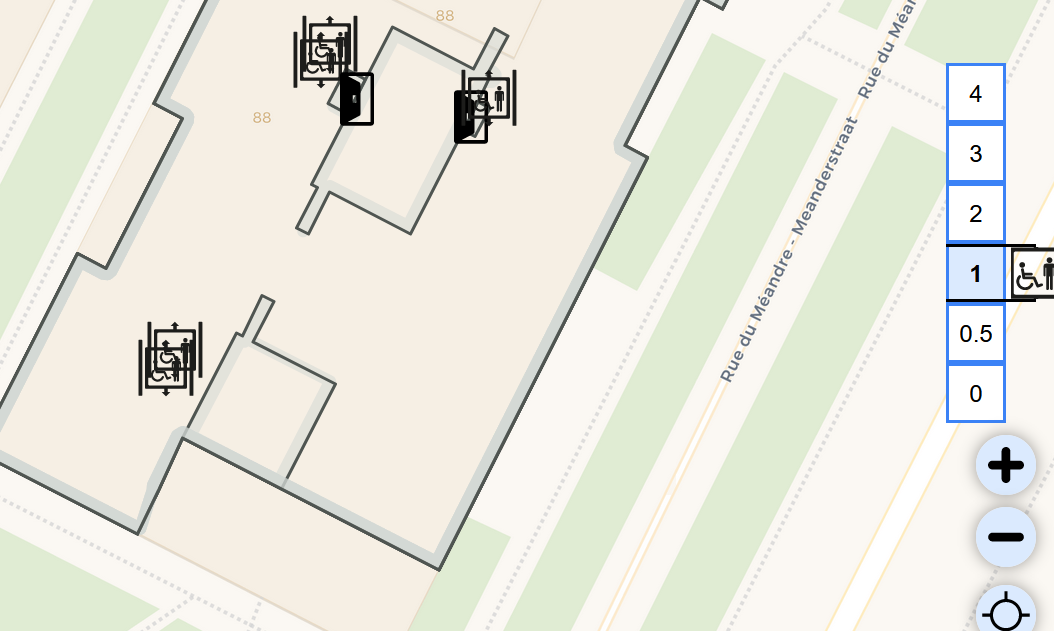
To make it easier to find your way indoors, there is now a special level selector allowing you to filter features by their level. There is also support for viewing rooms, doors and other objects inside buildings.
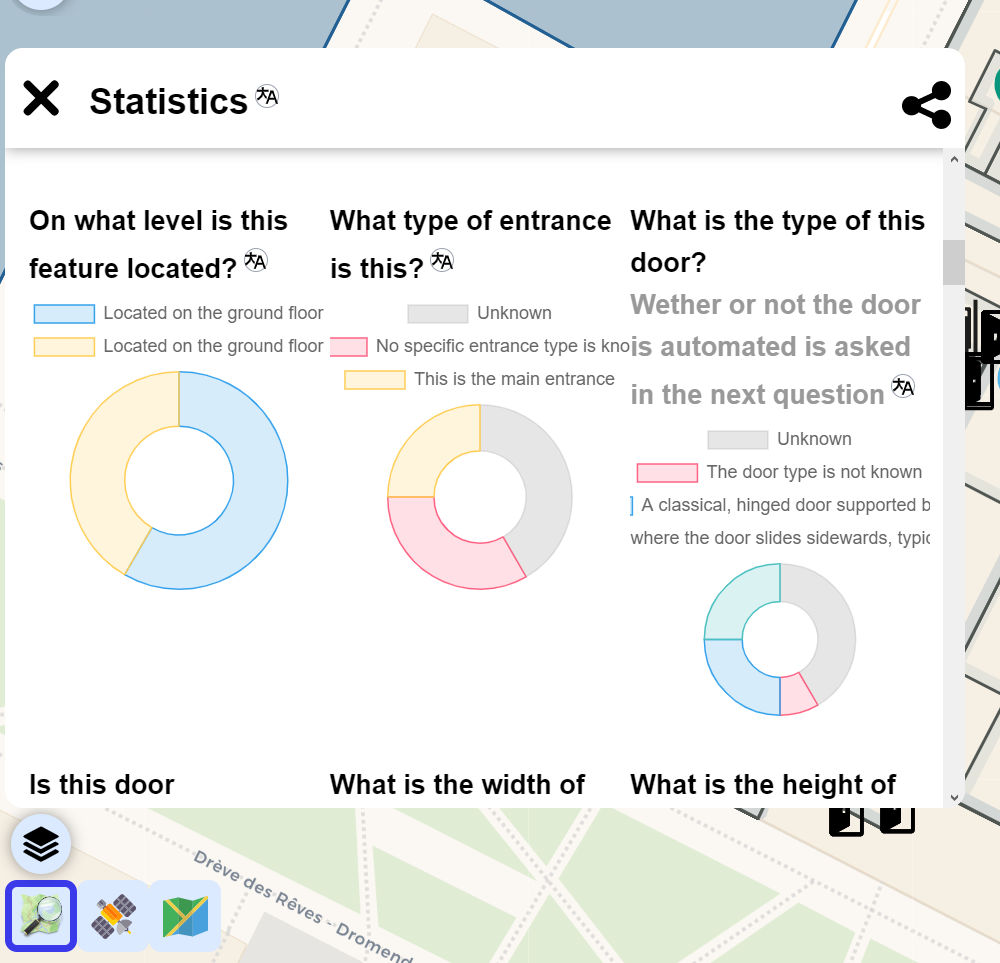
Improving accessibility isn't just making it easier to find places that are accessible. We also want cities and municipalities to be able to make use of the data, and get statistics about their city.
To make this possible, there now also is a dashboard mode showing statistics to give statistics on the data.
Want to know more? Have a look at the project to experience it for yourself.
Demo
The team
-

Robin van der Linde
Developer
-

Muhammad Rezaul Hasan
Developer
-

Alexander Rebai
Developer
-

Andrews Leruth
Developer